
Mayo Report for 2007-12
|
|
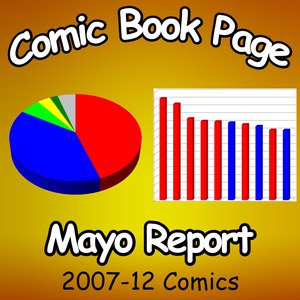
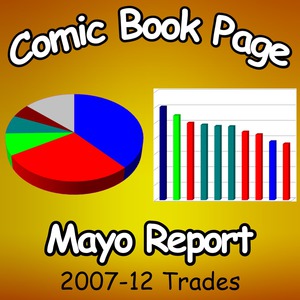
Top Comics List Top Comics Breakdown Top Trades List Top Trades Breakdown
A friend of mine is planning on opening up a comic book store in the near future and we had a recent exchange on the health of the comic book industry. His reasoning was that since the total sales of the top 300 comics have been trending up over the past few years, then the industry must be doing well. My monthly analysis focuses more on the sales trends of the individual titles over how the total sales of the top 300 comics and top 100 trades are doing. While the total sales do seem to be trending up, most individual titles are trending down. As a result, I'm not convinced that the industry is doing well.
As regular readers of my monthly analysis know, most of the titles I talk about are declining in sales. The reason is simple -- the Diamond data shows most titles are trending down. Rather than limit my focus to the small percentage of titles that are spiking in sales for the month, I try to cover a broader range of titles. I'm not trying to focus on the titles that are trending downward, but since a lot more titles are decreasing in sales rather than increasing every month, the titles I pick for my analysis reflect that trend.
I'll be borrowing some stock market terms and referring to items with an increase in estimated sales over the total reported sales of the previous issue as "advances" and items with a decrease in estimated sales from the previous issue as "declines." In both cases any reported activity for the prior issue during the current month is included in the calculations.
Also, the historical comparisons below only go back to February 2003. That is when Diamond started releasing "final order" data which measured what was sent and invoiced to retailers during the month. These historical comparisons do not include the "pre order" data prior to that point which was based on what the retailers initially pre-ordered and included many items that never shipped. Diamond released both pre order and final order data for February and March 2003. I'm ignoring the number of advances and declines for those first two months of final order data to minimize the impact of comparing final order estimates to pre order estimates. Diamond stopped releasing pre order data after March 2003.
In December 2007, there were only 20 advances (items with increases in sales) on the top 300 comics list. That is out of the 191 items with previous issues to compare against. The other 89 items had no previous issue to compare against because the item had no issue number, there was no previous issue, the item was reorder activity or the previous issue didn't make the top 300 comic list.
The question you should be asking at this point? "Is it normal for the number of advances to be that low?" The answer is no. December 2007 had the fourth lowest number of advances since the final order era began. January 2004 had the lowest number of advances with only 16 items. May 2007 had the highest number of advances with a record setting 76 items. On average, 39 items show an increase each month.
There is also the number of declines (items that went down in sales) to consider. December 2007 had 191 declines. Again, the question to ask is how that compares to the historical data. Out of the 57 months of data, December 2007 had 11th highest number of declines. February 2007 had the most declines with 217 items dropping in sales while April 2003 had the least declines with only 125. The second lowest number of declines was in May 2005 with 143 items. I mention that because April 2003 is the first month of advances/declines data that I'm using and is the first month that Diamond only reported final order information. The average number of declines is 171 items a month.
For those curious how often sales remain stable with no change, that has only happened a total of 12 times during the final order era. The most recent case of that was "Chronicles of Wormwood" #6 by Avatar in August 2007 with 8,266 units which was equivalent to the number of units of "Chronicles of Wormwood" #5 in July 2007. Note that the estimates were equivalent, not that there were the same. There is no way to know from the available data if the orders from the individual stores remained static or if some of the stores ordered less and other stores ordered more.
While that might seem like a meaningless distinction, it isn't. Static orders across all stores would imply that the demand for the title from the customers of each store is stable. However, if sales are dropping at some stores and increasing at other stores then there is a turnover in the readership and the sales aren't as stable as they might appear. The same holds true even if the sales appear to be going up or down. One of the important pieces of information that we don't get out of the Diamond data is this stability of sales. We don't know what percentage of the readers come back for the next issue versus how many left and were replaced by new readers.
Of those 20 comics that had advances in December, three had multiple covers, two were part of "The Resurrection of Ra's al Ghul" storyline running through the Batman titles and was a "mini-event" of sorts, one was a "magic number" issue and a final issue, and one was "Captain America" which is between major promotional pushes making the sales trend for the title abnormal because of the mainstream attention the title has been getting.
That leaves 13 advances, only one of which is for a title showing an upward sales trend over the past six months -- "The Walking Dead."
How important is this upward or downward sales trend for a title? It is more important than the specific increase or decrease for any given issue and much more informative than just comparing the current estimated sales for two titles. For example, "Spawn" #173 sold an estimated 23,121 units to retailers in December versus the 22,658 units for "The Walking Dead" #45. Comparing the two numbers implies "Spawn" is the title doing better. But "Spawn" has been trending down while "The Walking Dead" has been trending up. The two trend lines crossed around the end of November at about 23,000 units. Looking at it from that perspective, "The Walking Dead" is clearly the stronger title even though it is currently selling fewer copies.

Another question which you should be asking right now is how big the advances and declines are. Obviously it wouldn't matter if there are fewer advances than declines if the net difference is an increase in overall sales, right? And if the total sales of the top 300 comics have been trending up over the past few years, as I mentioned earlier, then that must be what is happening. After all, how could the aggregate sales of the top 300 comics being going up if the advances aren't more than the declines each month?
Let's test that theory...
In December 2007, the total of the advances was 30,618 units and the total of the declines was 507,048 units. That works out to an average of 1,530 units for each of the 20 advances and 2,654 units for each of the 191 declines. The net difference is a net decline of 476,430 units as compared to the previous issues of each individual title. Note that this is not the change in the total for the top 300 comics from the previous month. The total estimated sales for the top 300 comics in December 2007 was an estimated 7,024,971 units which was an increase of approximately 74,081 units from the estimated total of 6,950,890 units for the top 300 comics for November 2007.
Those two numbers are at odds with each other so you must be thinking that one of them has to be wrong. Well, both are right. They just measure different things.
The decline of 476,430 units is a total of the advances and declines for the month. The definition of an advance and decline involved comparing the sales of the current issue to the previous issue of that title. Not all titles are monthly. Some items like "Amazing Spider-Man" #545 are being compared to the previous issue which came out 16 weeks earlier and therefore wasn't part of the November data. Likewise, "Countdown to Final Crisis" shipped four issues during December and the decline for each of them was included in the total decline for the month. The increase of 74,081 units from November to December is a measure of the totals for the items on the list each month, not a measure of the change in sales on individual titles.
This still begs the question of how the total for the top 300 comics can be up when there were so many declines and many of those previous issues did ship in November. The answer is new titles.
New titles are the equivalents of an initial public offering on the stock market and are considered neither advances nor declines since there is no prior issue to compare against. In December 2007 there were 36 #1 issues. "Ultimates 3" #1 alone accounted for an estimated 131,310 units. The other #1 issues had a total of an estimated 652,806 units. Of that total estimated influx of 784,116 units from new titles, less than 100,000 came from ongoing titles and the rest are from one shots and the first issues of limited series.
Think about the implications of the constant influx of sales from new one shots and limited series. We are in a period of transient sales being a guiding force for the sales trends for industry and not in a good way. Not only do readers come and go on a title, but the titles themselves come and go.
The December data of 20 advances versus 191 declines, the averages of 39 advances versus 171 declines and the totals of 2,268 advances versus 9,795 declines during the final order era all clearly indicate it is significantly more common for sales to decrease than to increase.
The total of the advances in December of 30,618 units versus the total decline of 507,048 units, the average monthly total advances of 96,566 units versus the average monthly total declines of 406,851 units and the total advances 5,504,301 units versus the total declines of 23,190,509 units during the final order era all clearly indicate that the size of the sales drop is much larger than size of the sales increase.
But what does this mean for specific items on the monthly top comics and top trades lists?
The top ranked trade in December was the "Chronicles of Wormwood: The Last Enemy" graphic novel from Avatar. This is only the second time an item by a publisher that wasn't in the "premiere publisher" section of Previews took the top slot during the final order era. The other item was the "Family Guy" vol. 1 graphic novel in March 2006 with an estimated 15,840 units.
Some people might see this as "proof" that there is a strong demand for small press titles. There are far too many factors that influence the sales of comics and trades to just go with the simple answer without looking into things further first.
In this case, the other important piece of information is how many units the "Chronicles of Wormwood: The Last Enemy" graphic novel sold which was only a little over 6,000 units. This is rarely strong enough opening numbers for a trade to take the top rank for the month. Actually, the only other month with lower estimated sales for the top ranked trade was February 2004 when the "New X-Men" vol. 6 trade paperback topped the list with only 5,195 units. The average sales for the top trades are an estimated 10,812 units.
It is important to realize the ranking is based on when the item shipped and what other items were also released during that month. If the "Chronicles of Wormwood: The Last Enemy" graphic novel had come out two weeks earlier, it would have shipped in and the estimated 6,018 units it moved would have landed it in rank #8 behind the reorder activity for three other items.
Timing can be a major factor in where an item lands in the rankings since the ranking is relative to the other items on the list. While I'm sure this is obvious to most of you, as a college professor of mine once said, sometimes things are only obvious once they have been pointed out.
But, if the ranking isn't a reliable indication of how well an item did, what is?
The logical choice would be to use the number of units that the item sold. After all, this is a more objective yardstick to measure the sales with. The difficulty with that is putting those units into the proper context. Is selling 6,018 units considered good, bad or average? Answering that question can be much harder than it might seem.
On the one hand, in November 2007 the top ranked item was the "Heroes" hardcover from DC which sold an estimated 26,150 units. Compared to that number, the sales of 6,018 units for the "Chronicles of Wormwood: The Last Enemy" graphic novel seems fairly unimpressive. But is it really fair to compare a mass market property with a hit television show like "Heroes" to a small press comic book property? Probably not.
"Chronicles of Wormwood: The Last Enemy" is a 48 page original graphic novel that could have just as easily been considered a comic book and 6,018 units for a small press comic book is on par with (admittedly lower selling) titles from DC and Marvel. Those same 6,018 units would have placed at rank 225 on the top 300 comics list for December 2007 just above the "Wormwood One Shot" from IDW and just below the "Nexus Origin One Shot" from Rude Dude Productions.
It is a matter of perspective as to how well that graphic novel did. Personally, I think that given the current market conditions it did fairly well. It was the top ranked trade for the month and would have placed well for a small press title on the top comics list had it been over there.
But is this "proof" of readers turning more to small press publishers these days?
As far as trades go, maybe. DC and Marvel account for the majority of the sales of trades in the direct market but the other publishers account for a very significant portion of those sales. In December, Marvel had 34.43% of the total unit sales for the top 100 trades and DC had 20.69% leaving the remaining 44.88% for the other publishers. Typically publishers like Dark Horse, VIZ, Image and Tokyo Pop have strong showing on the trades list.
On the comic book side of things it is a different matter entirely. Usually the combined percentages for Marvel and DC total to around 85% of the total units sold for the top 300 comics. In December, Marvel had 46.77% of the total units and DC had 39.85% for a combined total of 86.62% of the total units sold for the top 300 comics list. Dark Horse had 3.42% and Image had 3.24%. The result is the premiere publishers listed in the front of Previews each month accounted for 93.28% of the total sales of the top 300 comics in December. This should illustrate the influence of a comic book being in the front portion of Previews versus lost in the back half of the catalog.
What the data is telling us is the core of the sales for the top 300 comics are Marvel and DC. Fortunately, many of the small publishers are able to survive and even thrive on lower sales levels. Heck, Claypool Comics survived for a decade with only a handful of items ever making the top 300 list over that time. Sales levels that could be considered a disaster for Marvel and DC are often considered a huge success for a small press publisher.
To put the difference in sales levels between the premiere publishers and the small press publishers into perspective, the total sales in December for the small press publishers (everything except Dark Horse, DC, Image and Marvel) was an estimated 472,251 units. The total for the top five items from Marvel in December was an estimated 564,701 units. The total for the top five items from DC in December was an estimated 447,164 units. Both Marvel and DC each had nearly 100 items on the top 300 comics list in December.
The point that I made to my friend was that the business of selling comics all boils down to an individual customer buying an individual comic. It is those specific transactions that make up the basis of these numbers even though they are not the direct source of this data. Comic book retailers make money on each comic sold to a reader. It is the repeat business of a reader picking up the next issue of a title that helps keep the comic book store in business. If that repeat business is constant then any new reader of a title is an increase in sales for that store. But what the sales estimates are indicating is that as established titles go, it is more common for readers to drop a title than to add one.
Keep in mind that the Diamond data measures sales to retailers, not readers. Essentially the retailers are acting like an electoral college. The sales of the previous issues of each title to the customers at each store act as "popular votes" for those titles. Retailers are not obligated to order based on that information, but they usually do while also factoring in things such as creative team changes and price changes. If fewer customers buy a given title at a given store, that store will most likely reduce the number of copies ordered on future issues. Likewise, if more customers start buying a given title, the store will probably increase the size of future orders of that title. It is sort of like using the popular vote for the previous election as a guide to the electoral vote for the current election. There is a time lag between the sales trends at the customer level and those trends being reflected at the retailer level and in the Diamond data. It isn't currently known how long or short this time lag is and can't be known until sales to readers are tracked and reported on. Stores with pull list services allow customers to pre-order comics thereby placing a "popular vote" in the current "election." While the sales to retailers are not an exact reflection of the sales to readers, they are reasonably reflective of the basic sales trends of the readers. And what we are doing here is looking at the sales trends using the estimated sales as a guide.
What all of this means is for titles to level out in sales and go up, more readers need to be brought in to the titles each month. Since the data indicates that titles are generally unable to keep readers coming back, it means that these readers need to come from outside of existing pool of readers versus just trying to recycle the current crop of readers.
Marketing for a churn based business in which customers come, stay for a bit and then leave requires reaching outside the existing customer base. It is also a very different type of marketing than is done for a business model with a low turnover rate. Marvel is doing a great job of trying to expand the pool of readers with things like Joe Quesada's appearances on "The Colbert Report." But this effort to get new readers needs to be an industry wide effort. Free Comic Book Day is a step in the right direction but perhaps it is time for a "Got Comics?" campaign championed by a retailer organization like ComicsPRO in cooperation with Diamond, Marvel, DC, Dark Horse, Image and other publishers. It will take a joint effort across the publishing, distribution and retailing levels of the industry to successfully leverage the cultural acceptance that comics currently have into an increase in sales across the board. But that is a pipe dream for now and a no doubt poses a logistical nightmare to make it a reality.
Just like the "Got Milk?" advertising campaign re-energized the sales of milk after a 20 year slump, a similarly styled campaign could bring in the new readers needed to re-energize comic book sales. While the total of the top 300 comics and top 100 trades are increasing, most individual titles are declining in sales. This results in titles getting retooled or cancelled and replaced only for those tittles to also fall victim to the declining sales. Analyzing the sales estimates over the course of a few years is like watching skeet shooting. Somebody yells "Pull!" and the publishers toss out a bunch of new titles for the retailers and readers to shoot down. Reload and repeat.
There is a very real need to begin in new customers and get them hooked on reading comic books. The upward trends of the top 300 comics and top 100 trades mask that need and are generating a false sense of security about the health of comic book sales.
But getting new readers is only part of the battle. The other thing that needs to be address is why titles are unable to retain the readers they have. Until that problem is solved the comic book industry is operating increasingly on a churn based model. The days of publishers and retailers being able to count on loyal readers returning each and every issue are long since over according to the sales trends I'm seeing in the Diamond data. That is why I'm not convinced that the industry is doing well.
As always, if you have any questions or comments on these numbers and what they do and don't mean, please feel free to .
![]()
![]()